Executive Financial Intelligence Dashboard in Power BI
Project Description
Design and implementation of an executive dashboard in Power BI focused on comprehensive monitoring and analysis of the organization’s financial performance.
The solution consolidates key financial indicators, cumulative results, monthly trends, and financial statement analysis into a dynamic and interactive platform, enabling the evaluation of liquidity, profitability, financial structure, and business evolution from a single executive view.
The project transforms traditional financial information into actionable business intelligence to support strategic decision-making.
Challenge
The organization faced several challenges in analyzing financial information in a timely and consolidated manner:
- Information distributed across multiple reports and spreadsheets
- Manual processes for evaluating financial indicators
- Limited executive visibility into trends and performance
- Difficulty correlating operational results with financial indicators
- Limited capability for dynamic analysis by periods and scenarios
Additionally, traditional financial statements did not provide fast managerial insights for decision-making.
Implemented Solution
An interactive Power BI dashboard was developed, integrating financial modeling, executive visualization, and management indicators into a unified solution.
Main Dashboard Components
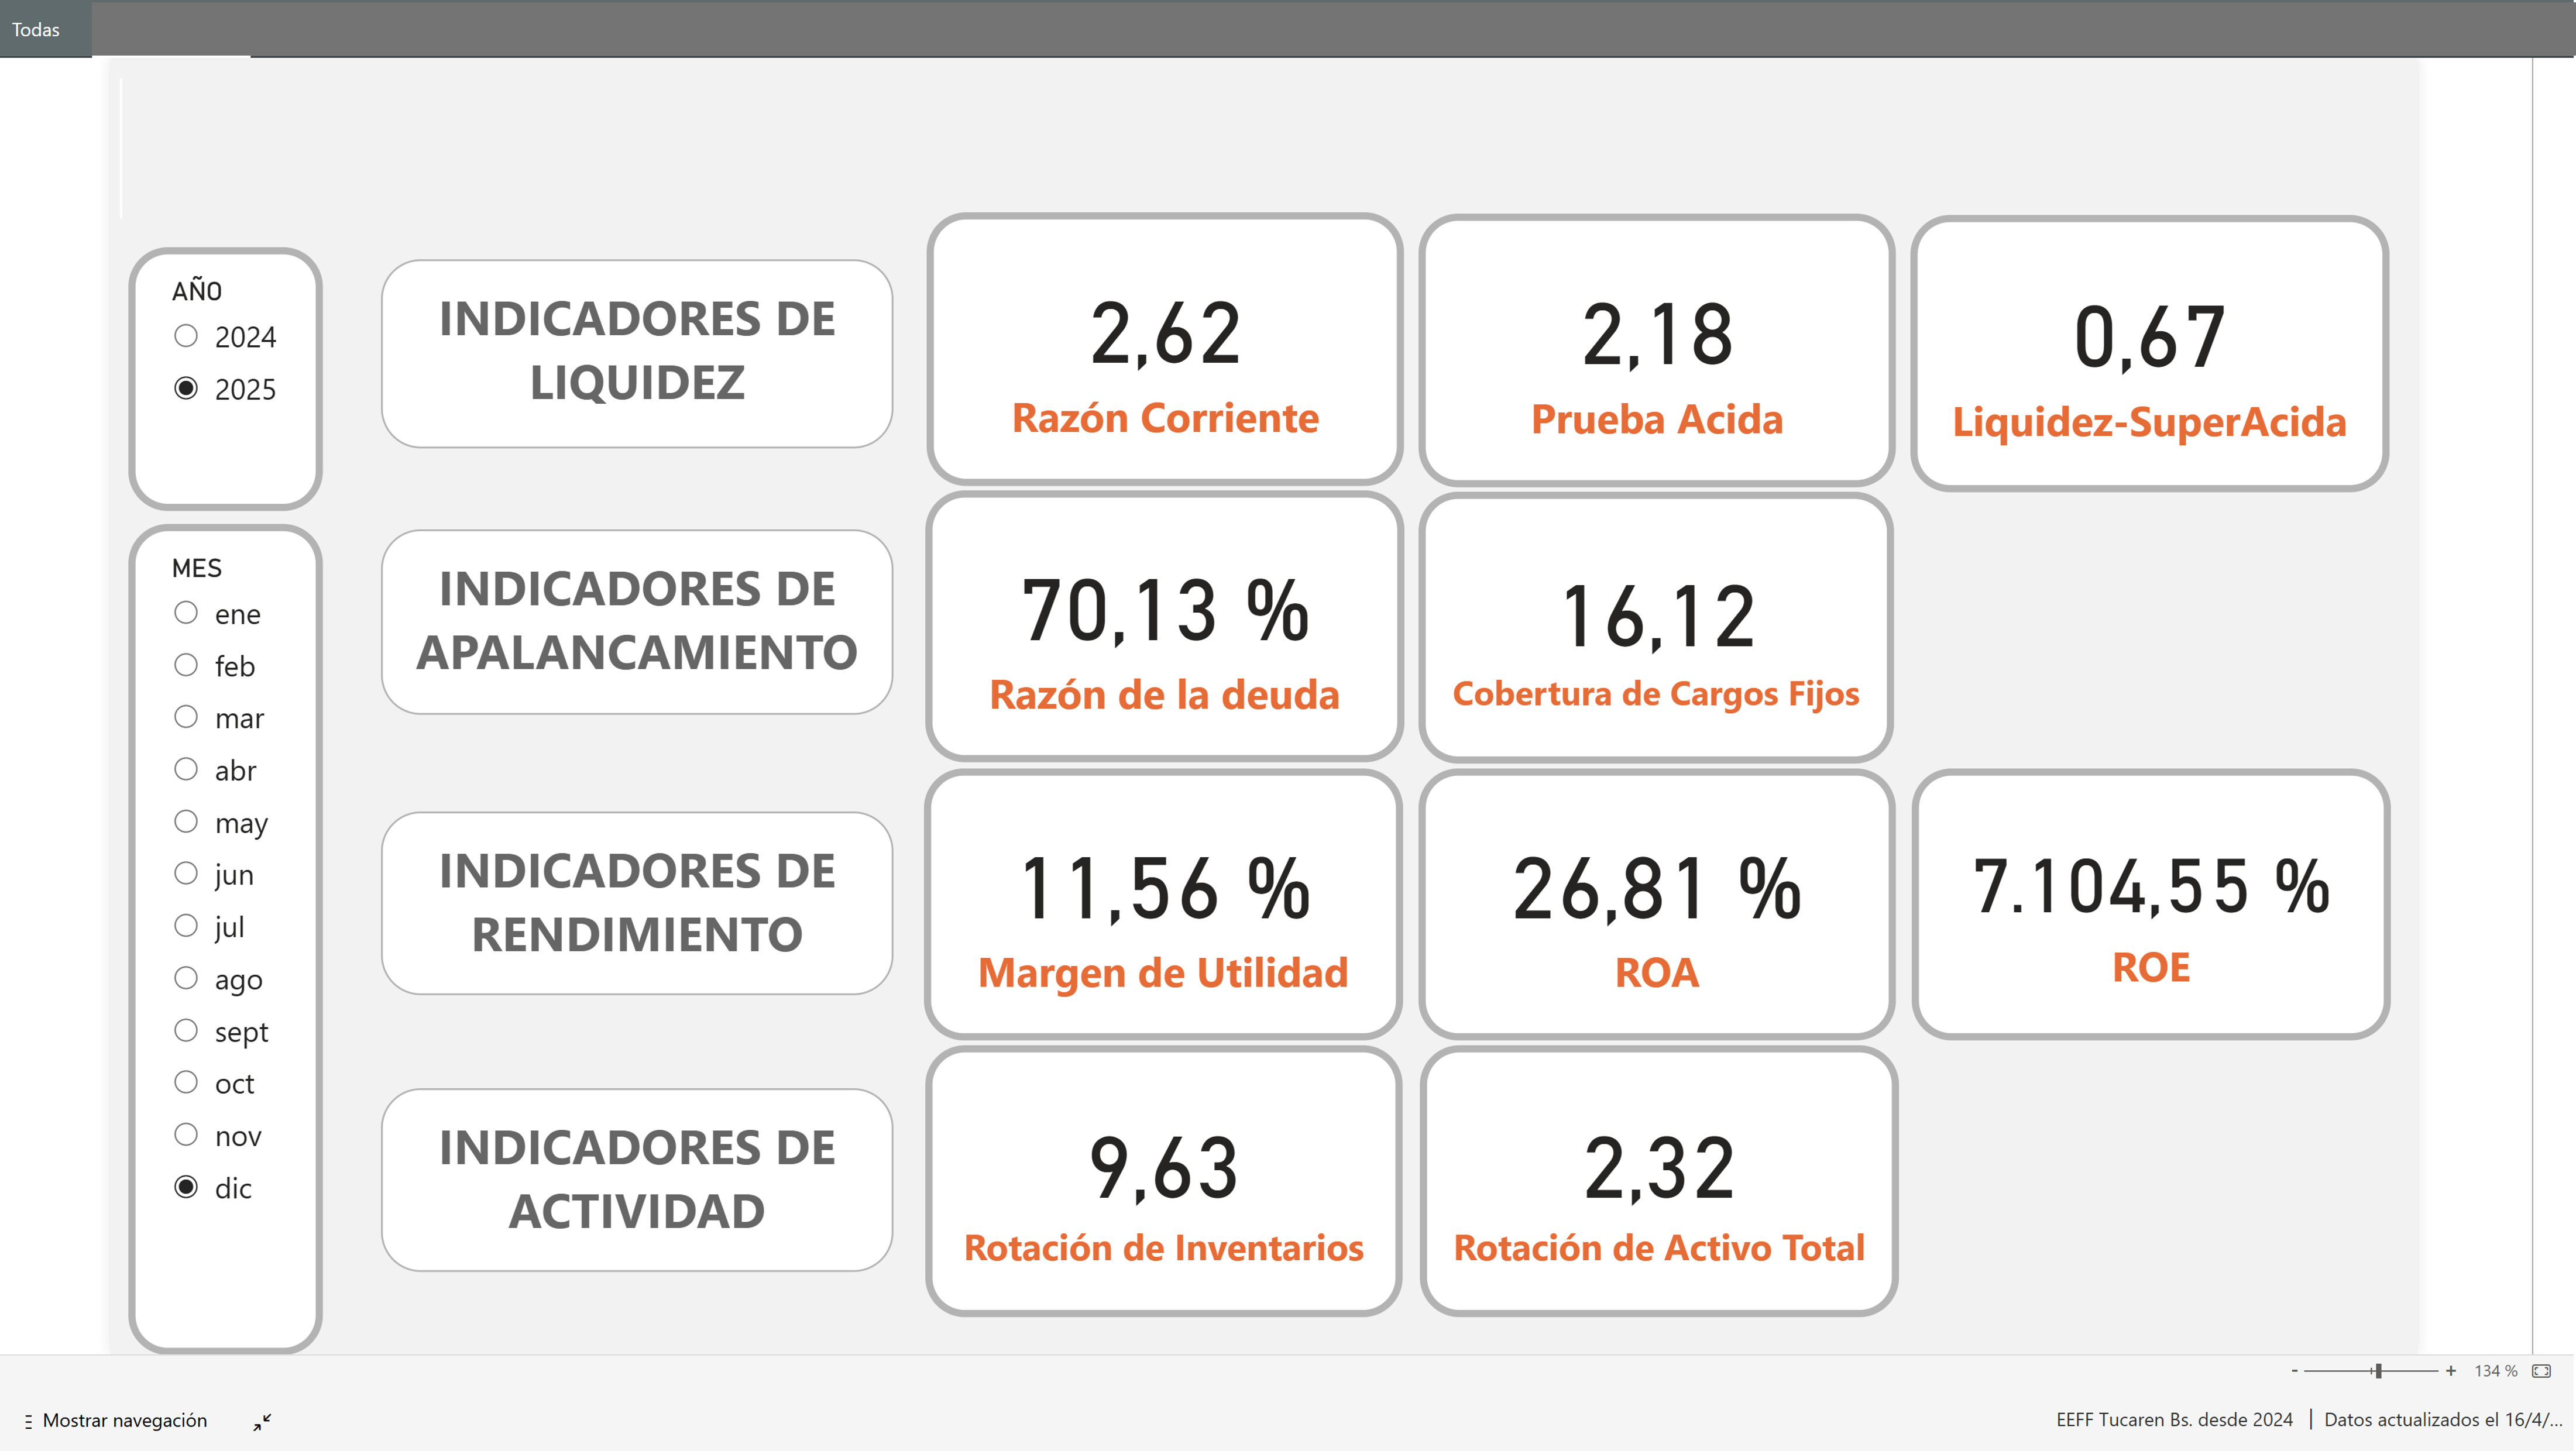
Financial Indicators
- Monitoring of key financial ratios:
- Current Ratio
- Quick Ratio
- Super Acid-Test Ratio
- Debt Ratio
- Fixed Charge Coverage Ratio
- Profit Margin
- ROA
- ROE
- Inventory Turnover
- Asset Turnover
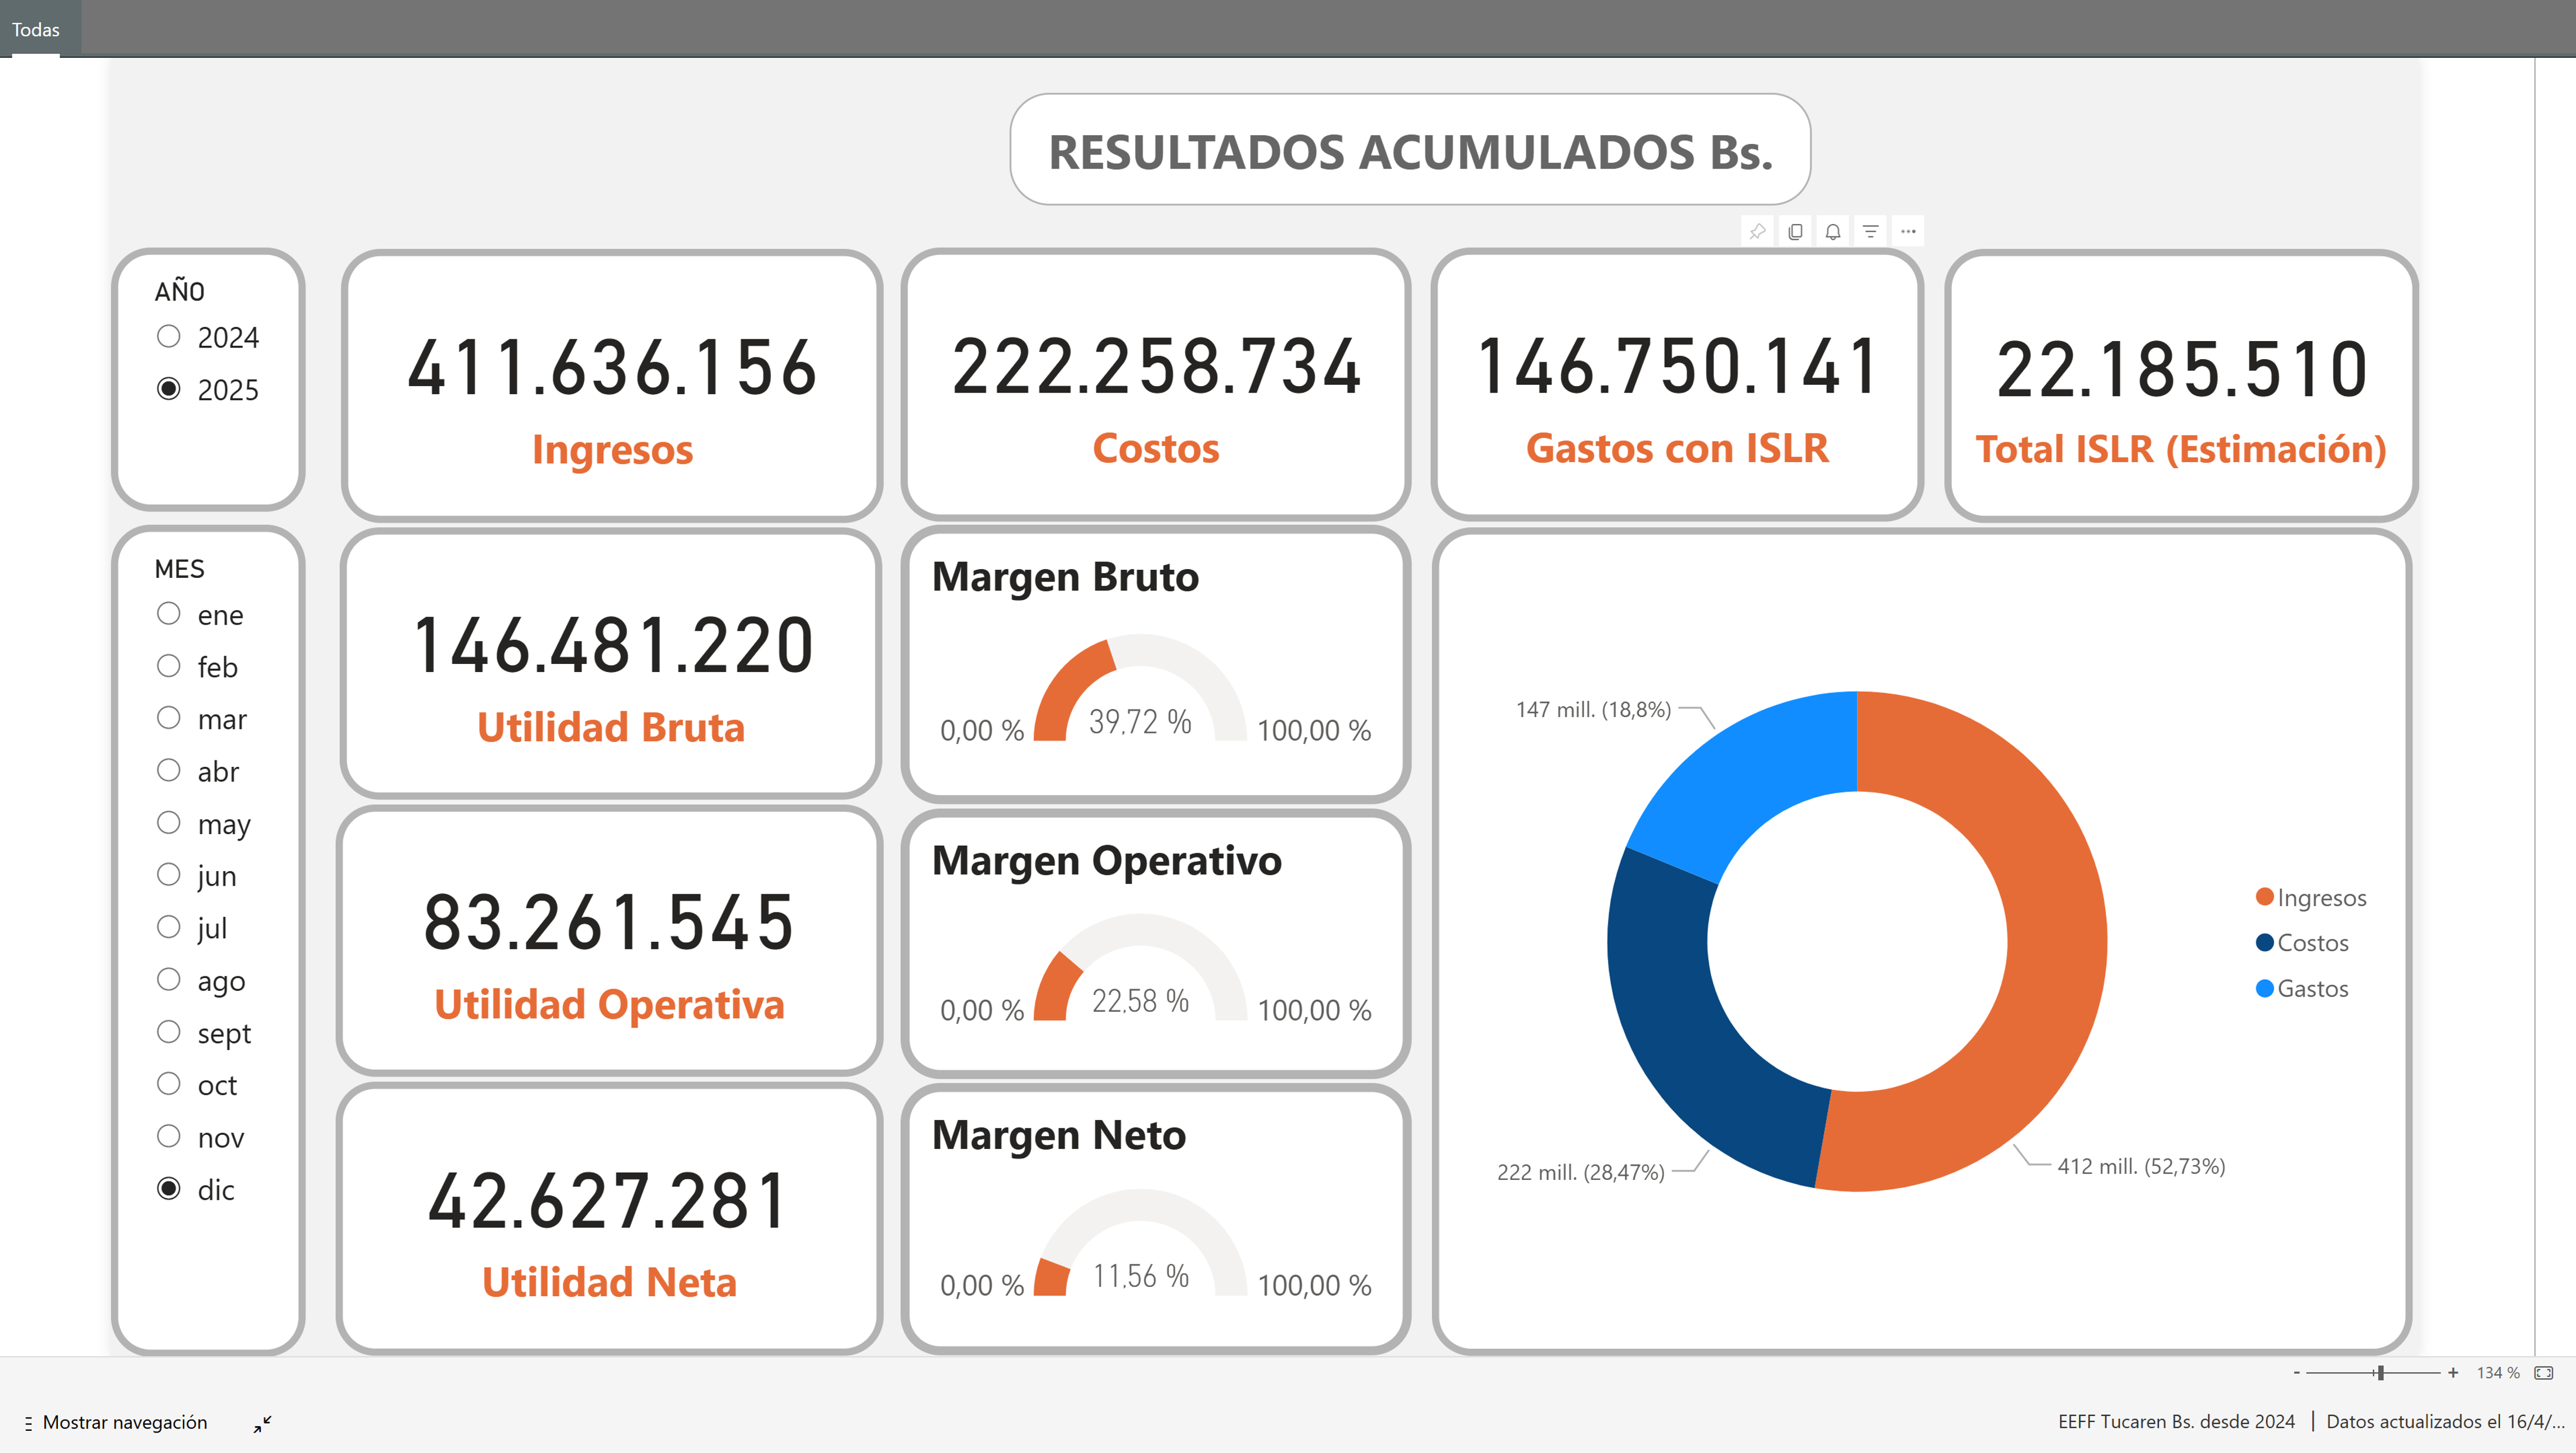
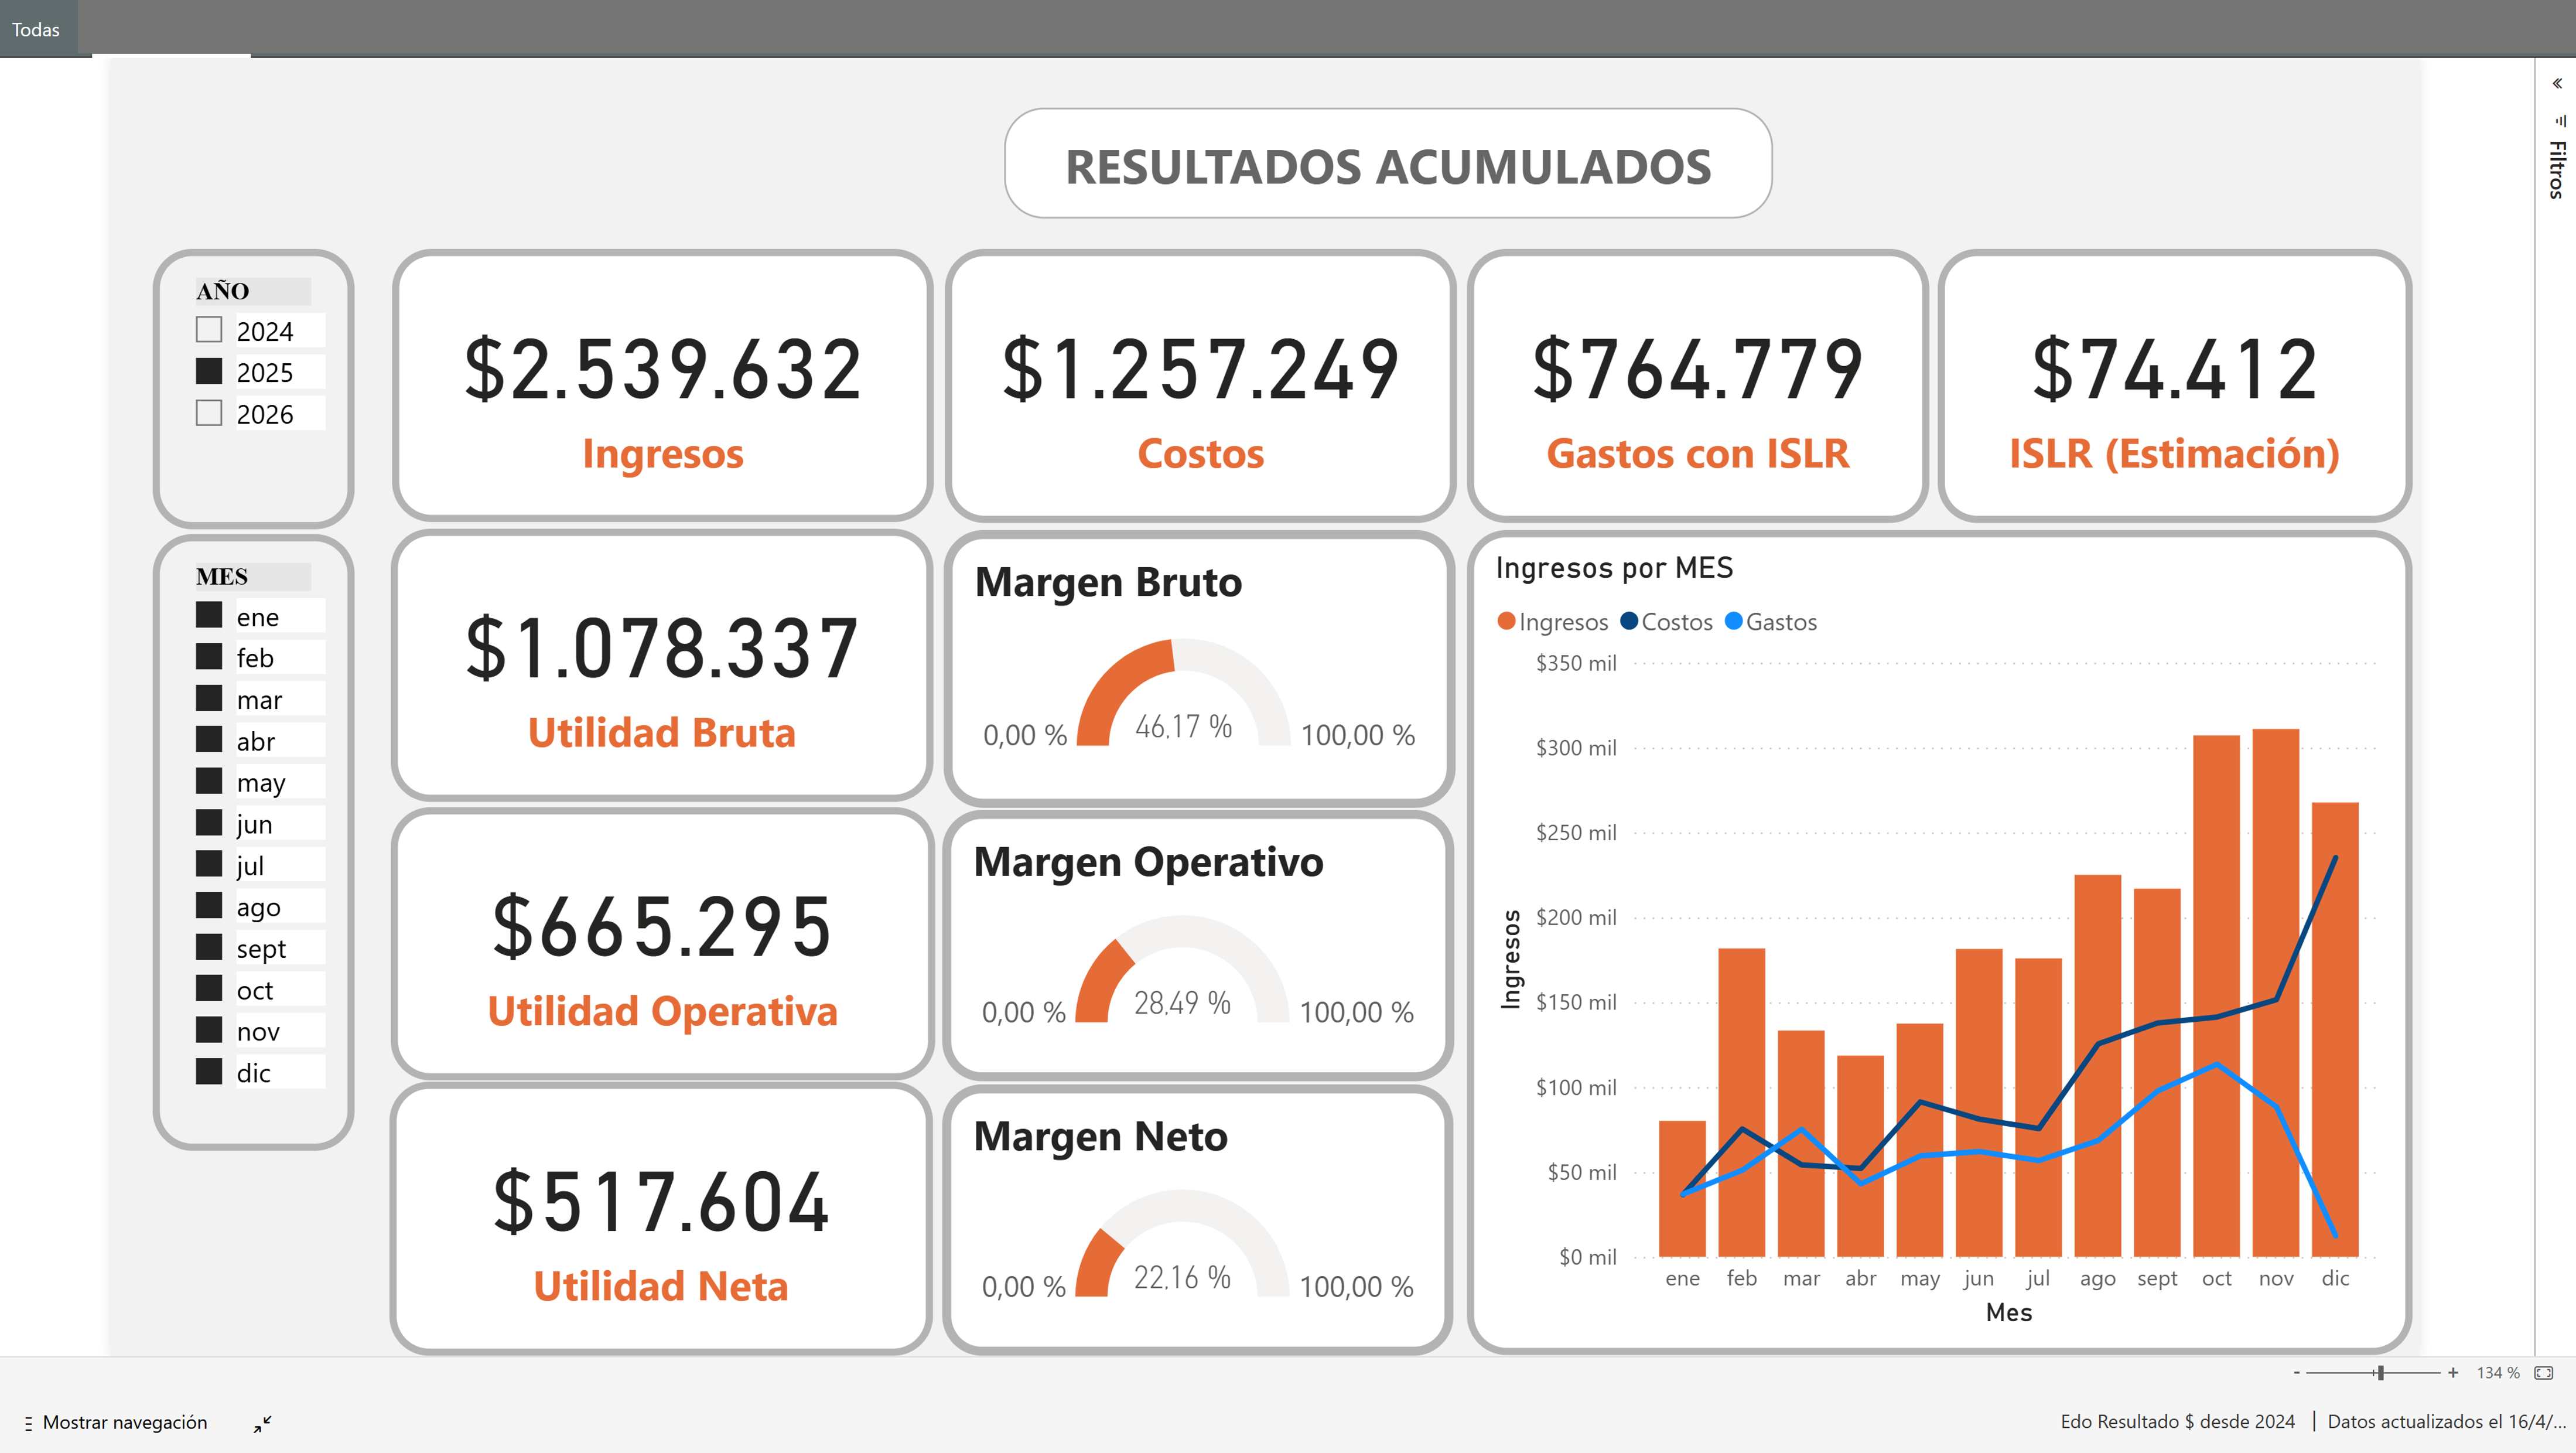
Cumulative Results
- Consolidated visualization of monthly evolution for revenues, costs, and expenses:
- Revenue
- Costs
- Expenses and estimated Income Tax
- Gross Profit
- Operating Profit
- Net Profit
- Financial Margins
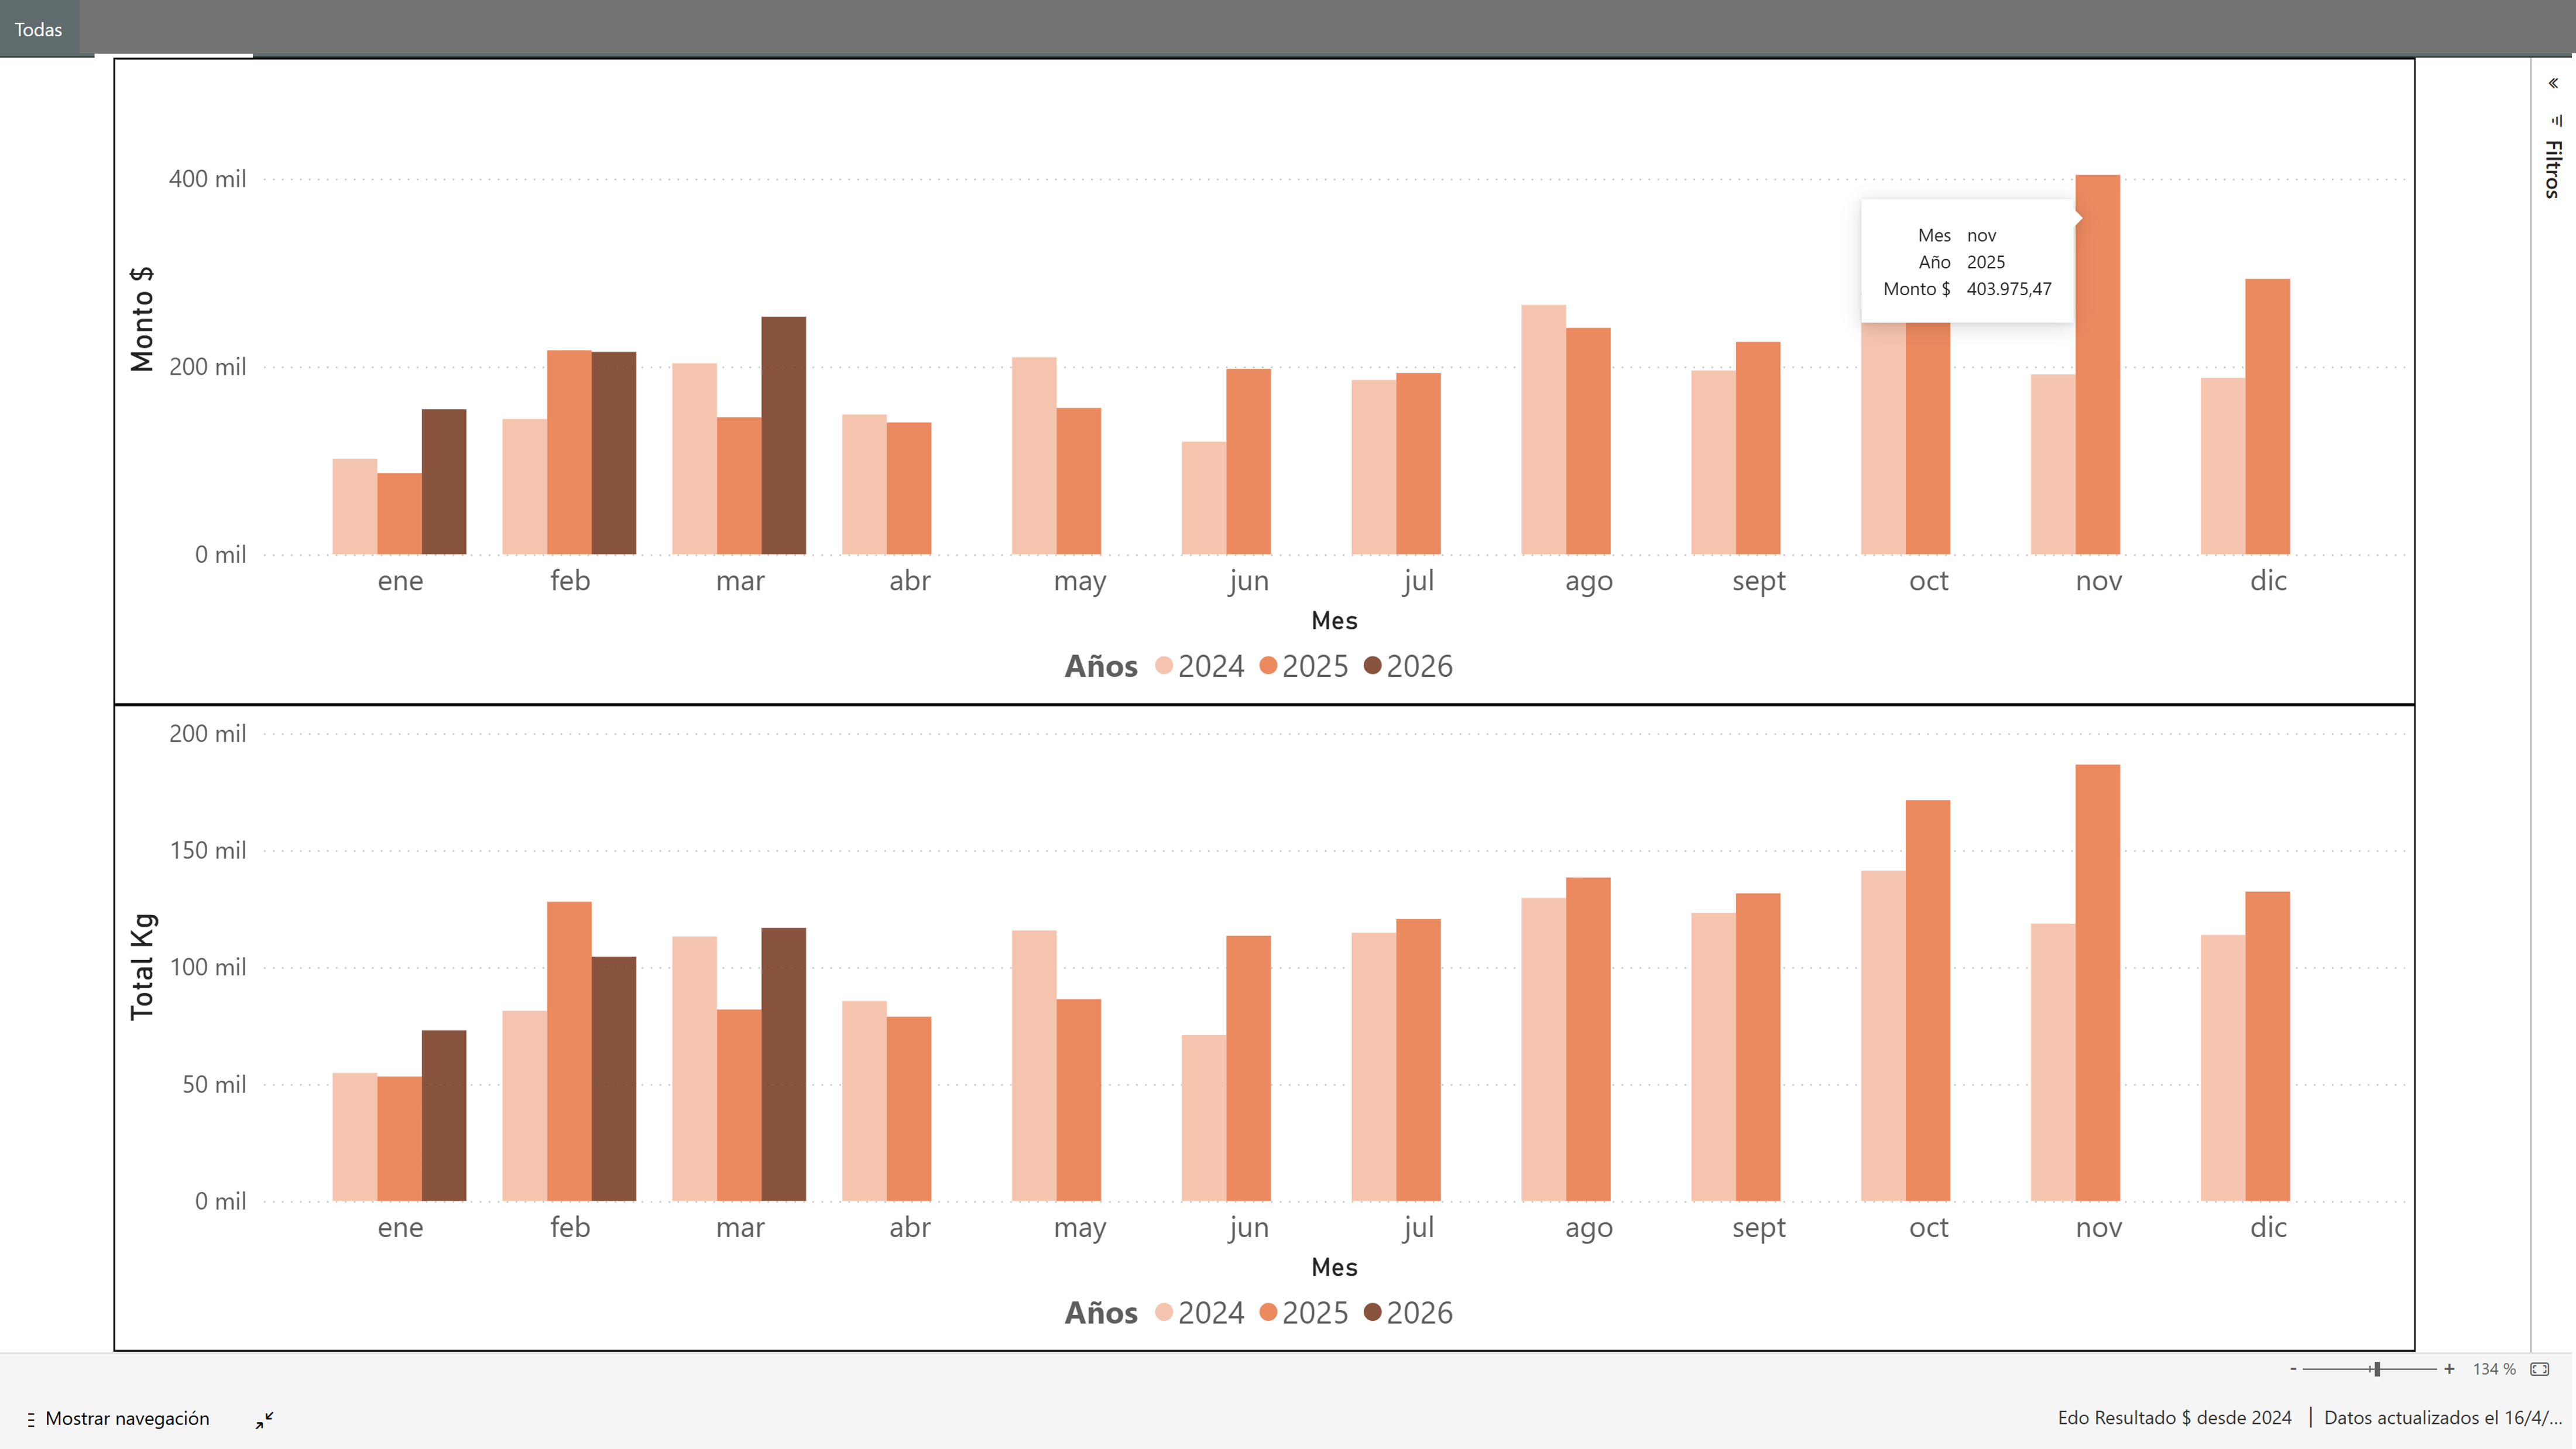
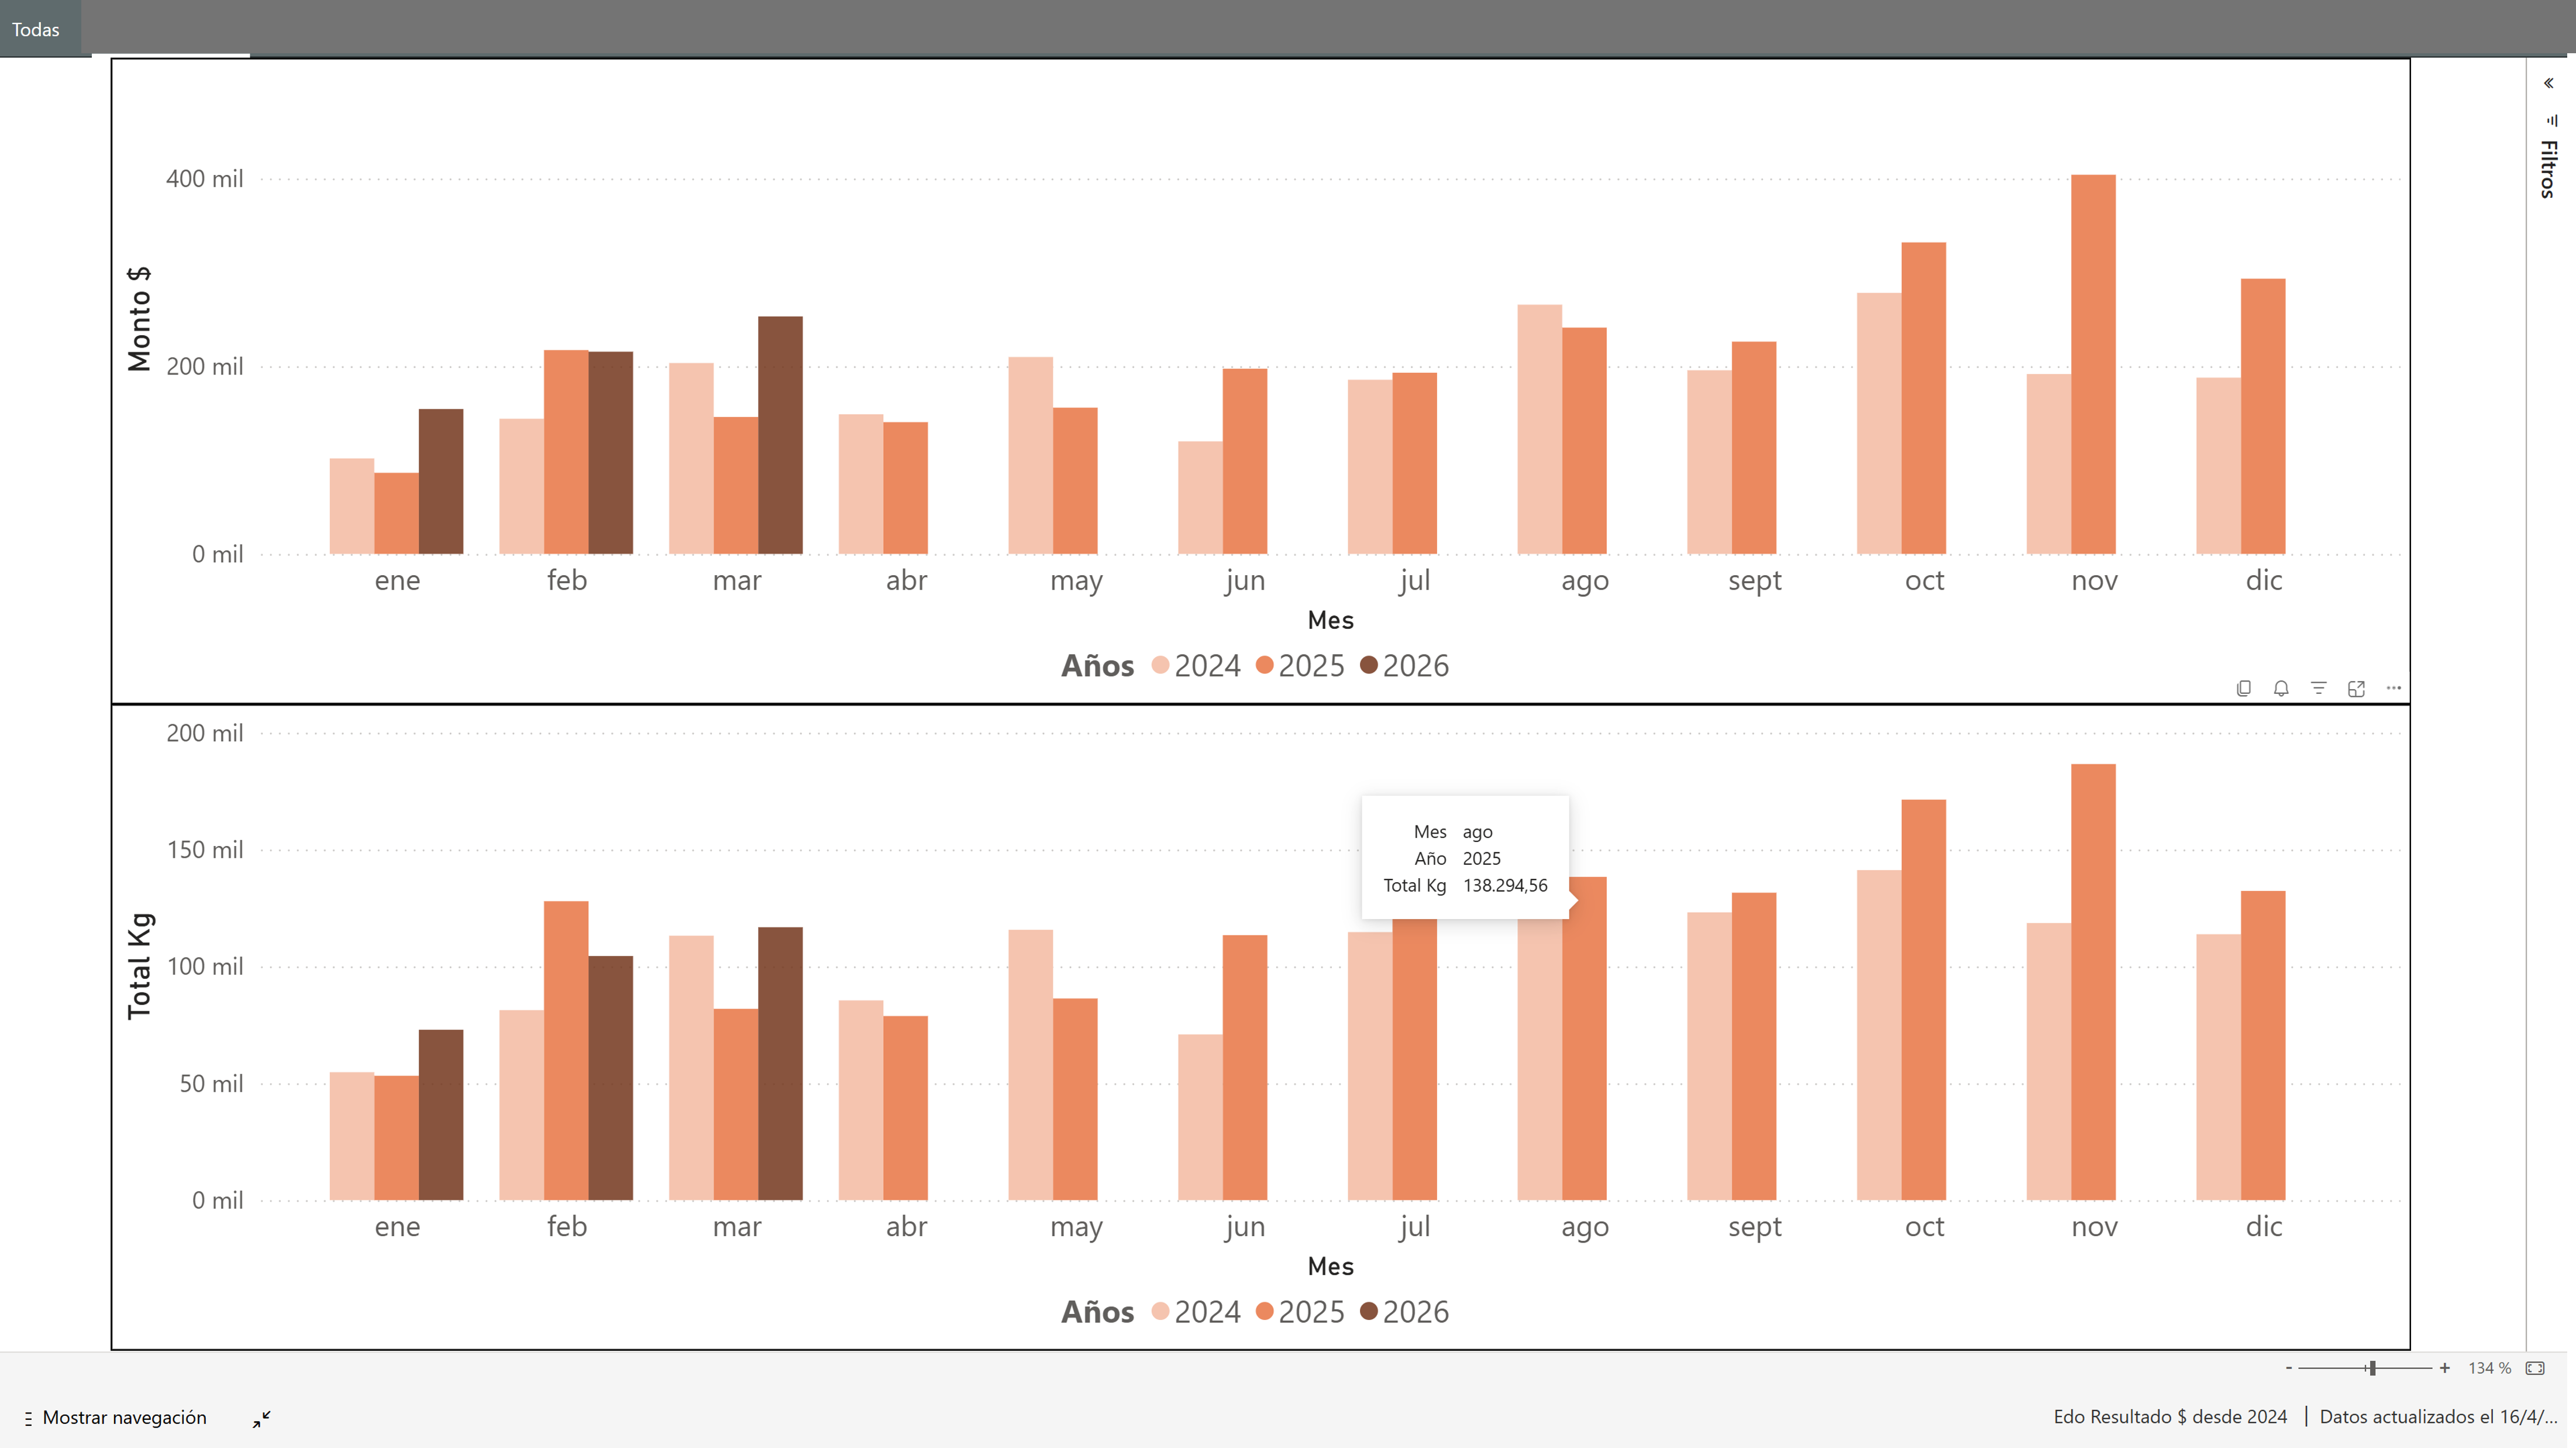
Comparative Analysis and Trends
- Period-over-period performance tracking for:
- Sales Amount (USD)
- Commercialized Volume (Kg)
- Year-over-year monthly trends
- Annual comparisons
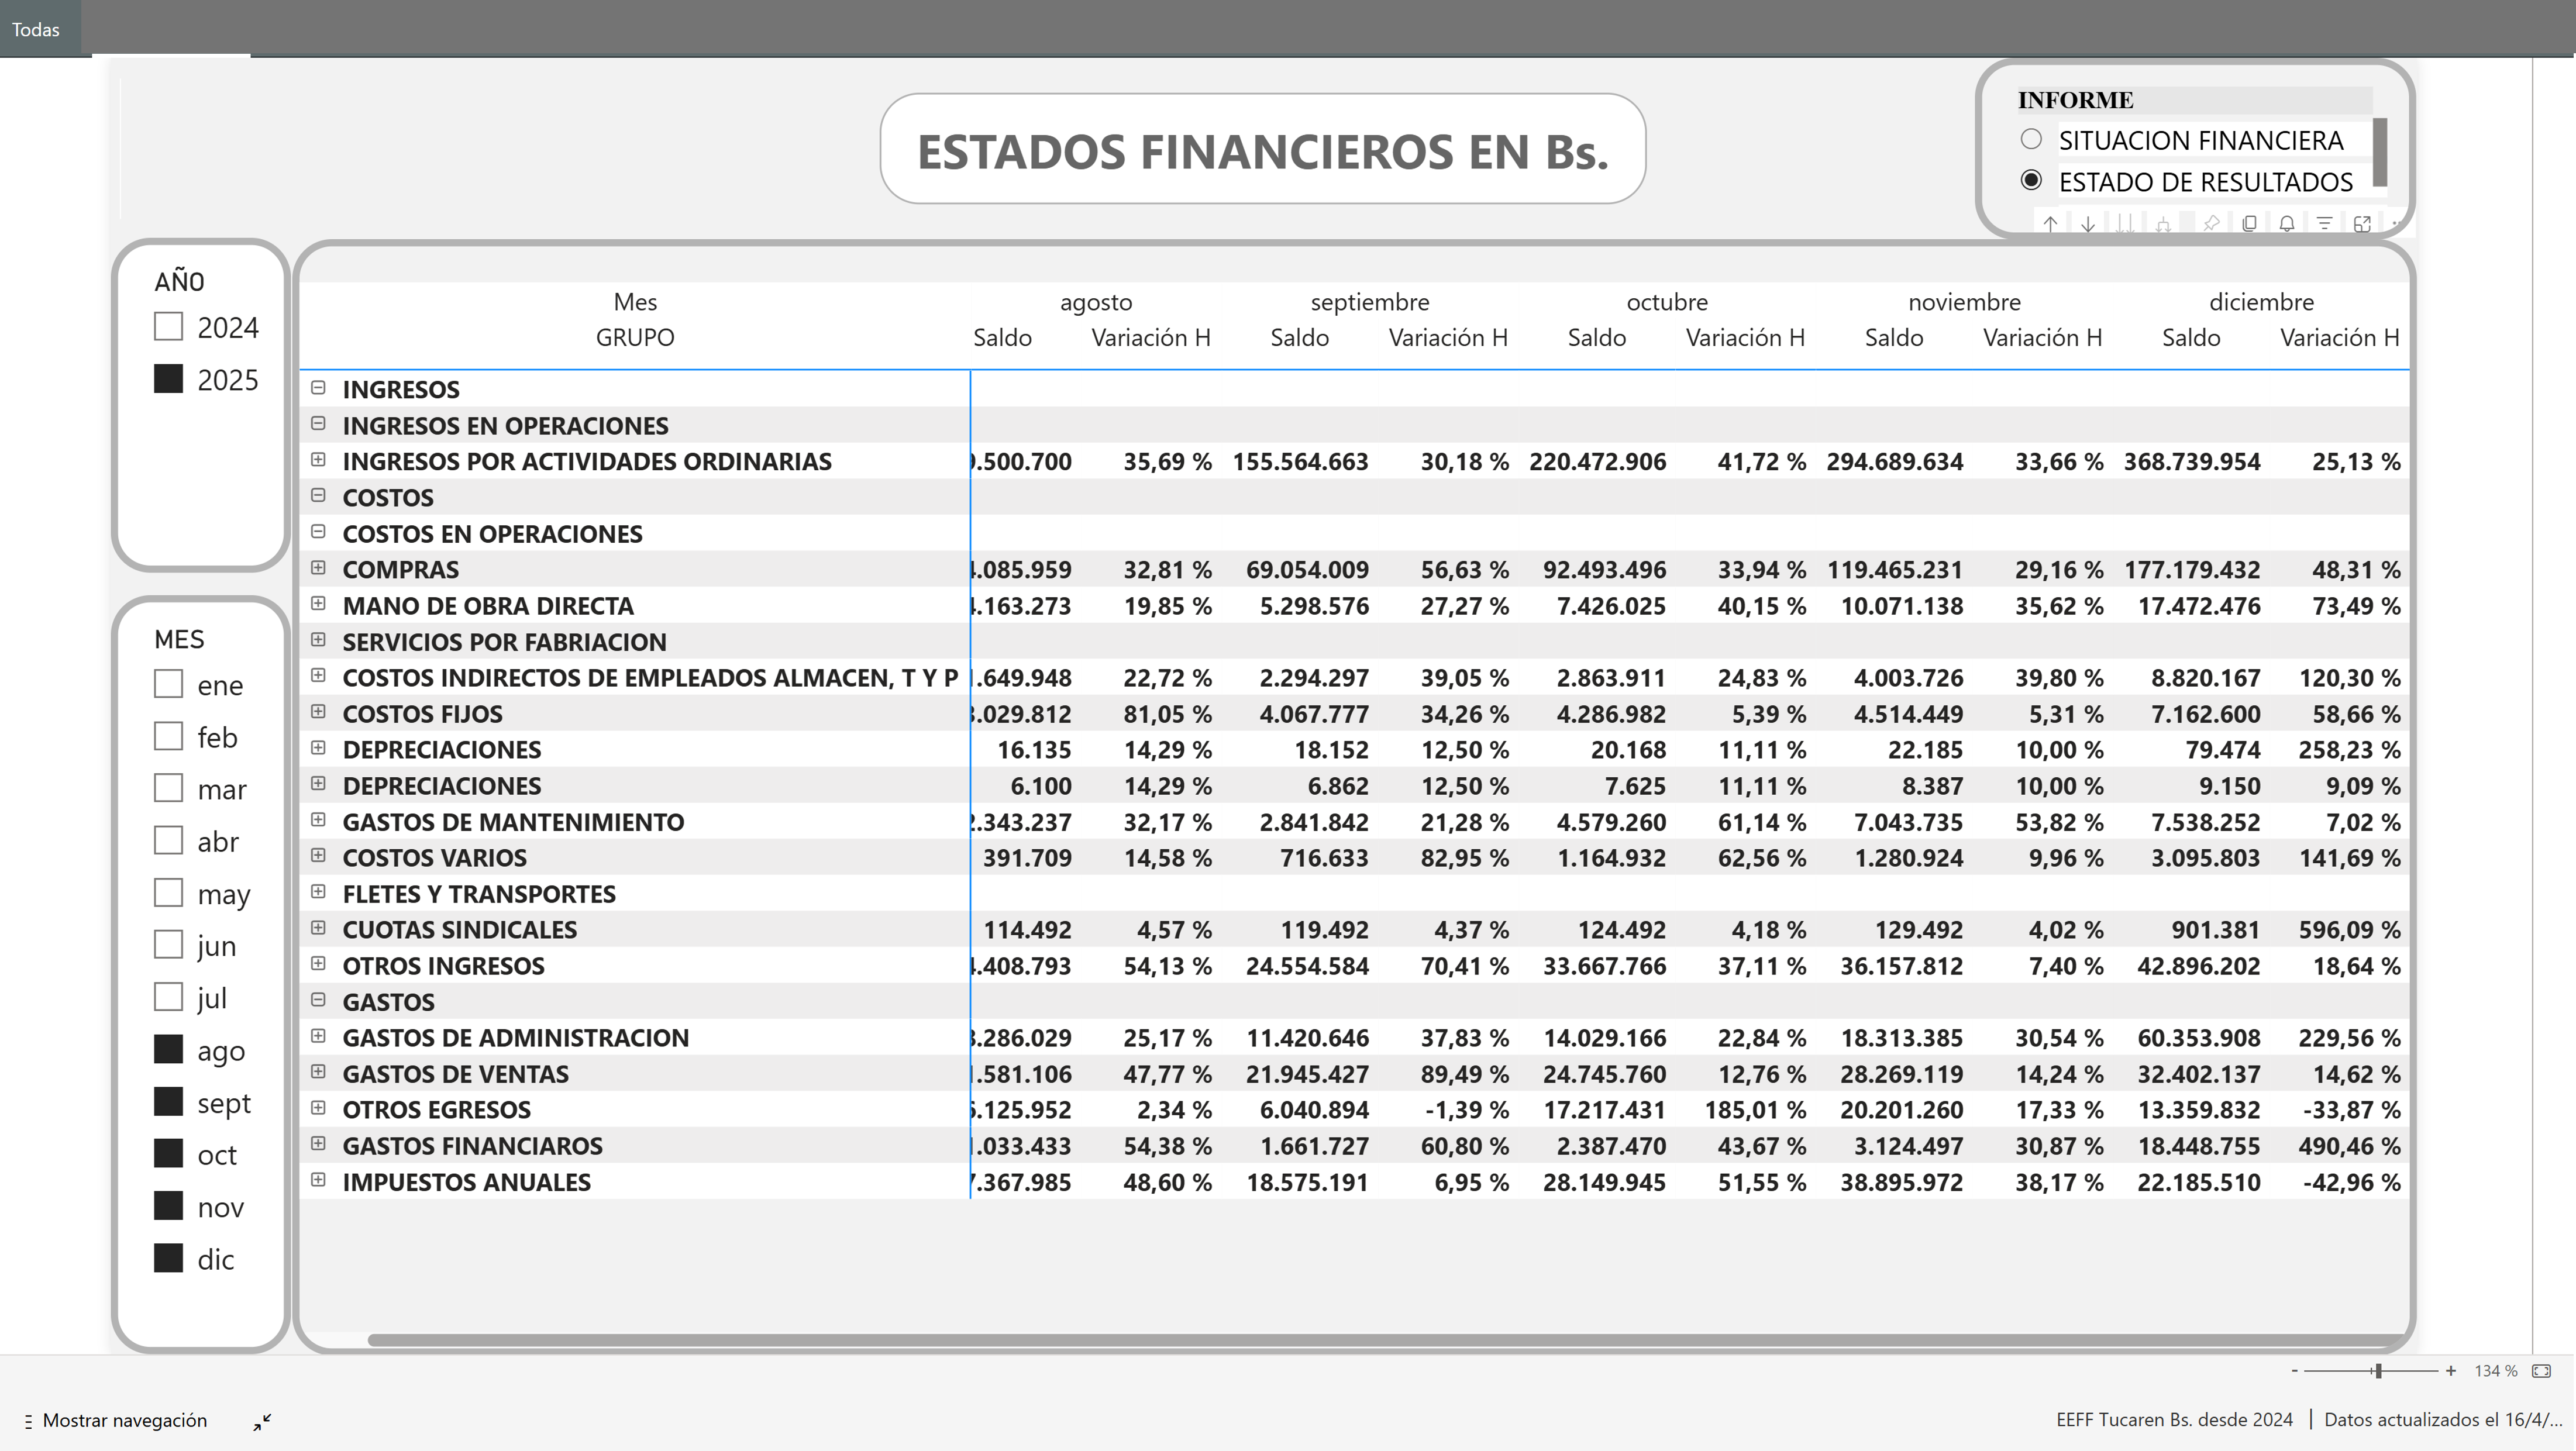
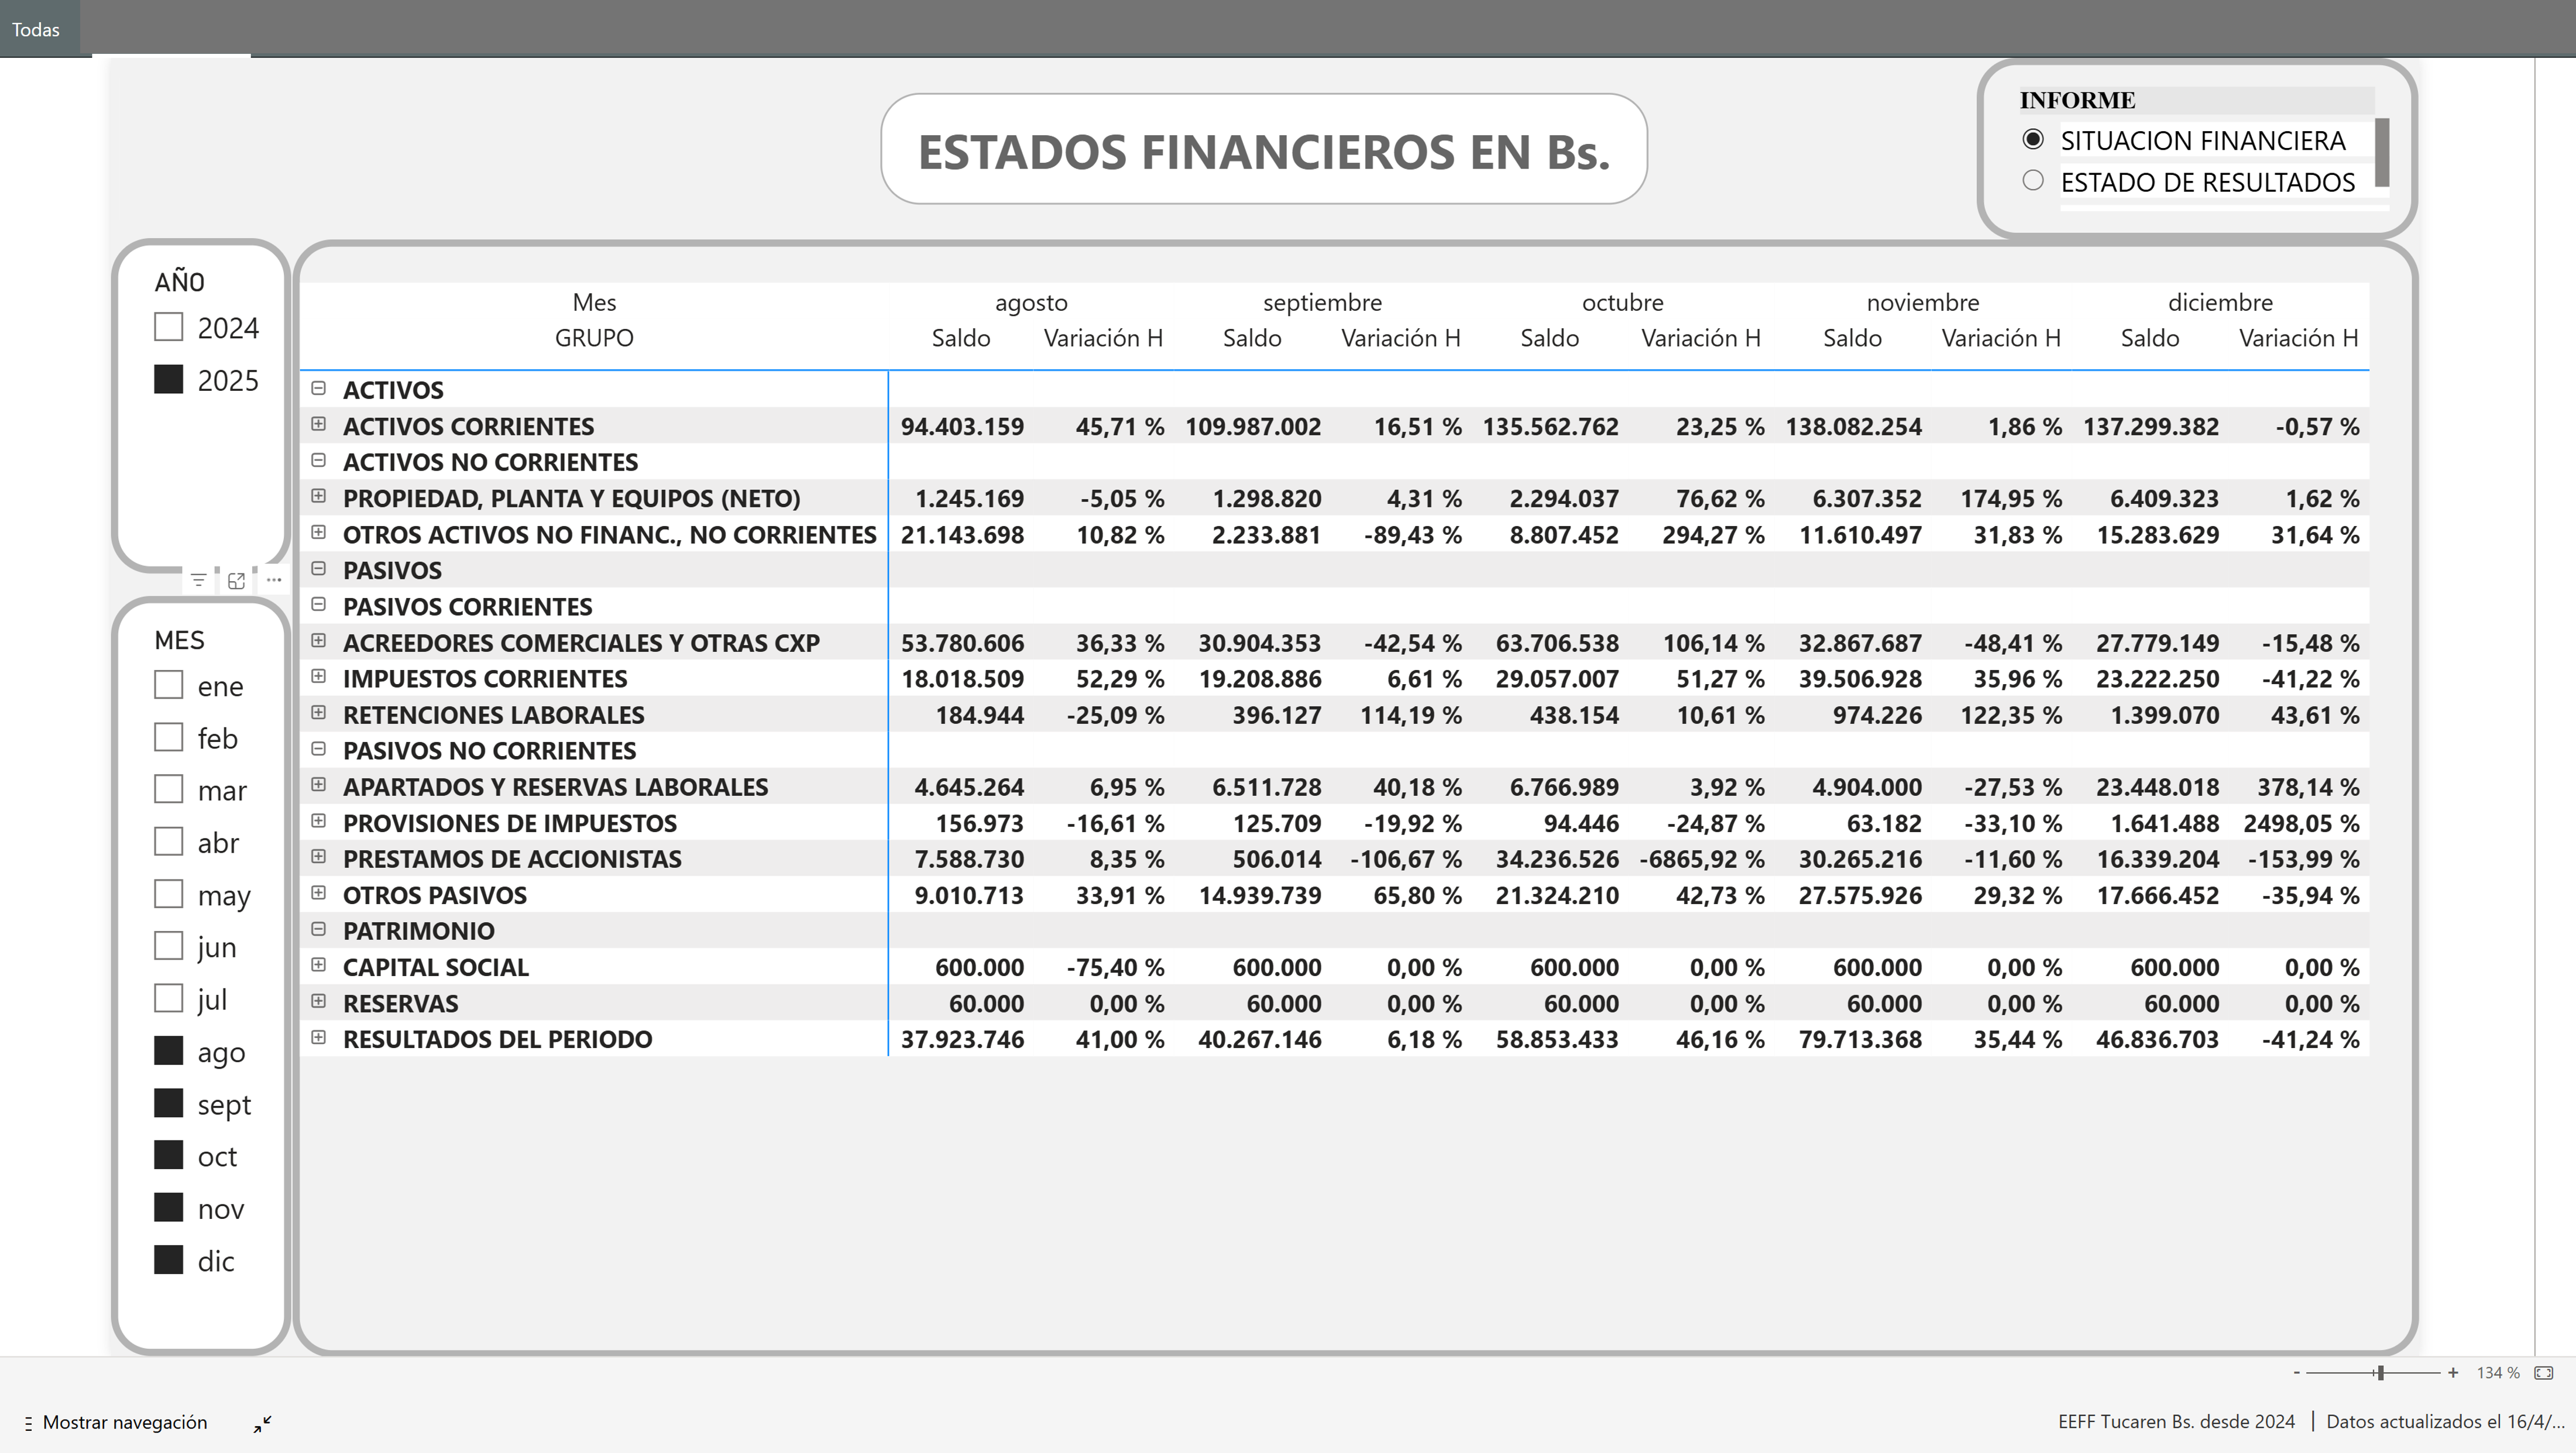
Dynamic Financial Statements
- Integration of interactive analysis for:
- Financial Position
- Income Statement
- Horizontal Variance Analysis
- Account and period-based analysis
Technologies and Tools Applied
- Data modeling in Power BI
- Data transformation and preparation with Power Query
- Measures and KPIs using DAX
- Executive and interactive visualization design
Results Achieved
The solution generated significant improvements in financial analysis and management:
- Centralization of financial analysis into a single platform
- Greater visibility into liquidity, profitability, and leverage
- Reduced analysis and reporting times
- Dynamic monitoring of financial performance by period
- Early identification of trends and relevant variations
- Strengthened analytical support for managerial decision-making
The project transformed traditional financial reports into an executive monitoring system focused on management efficiency and value creation.